Closing the Reporting Gap in Rose Production
The Recurring Problem
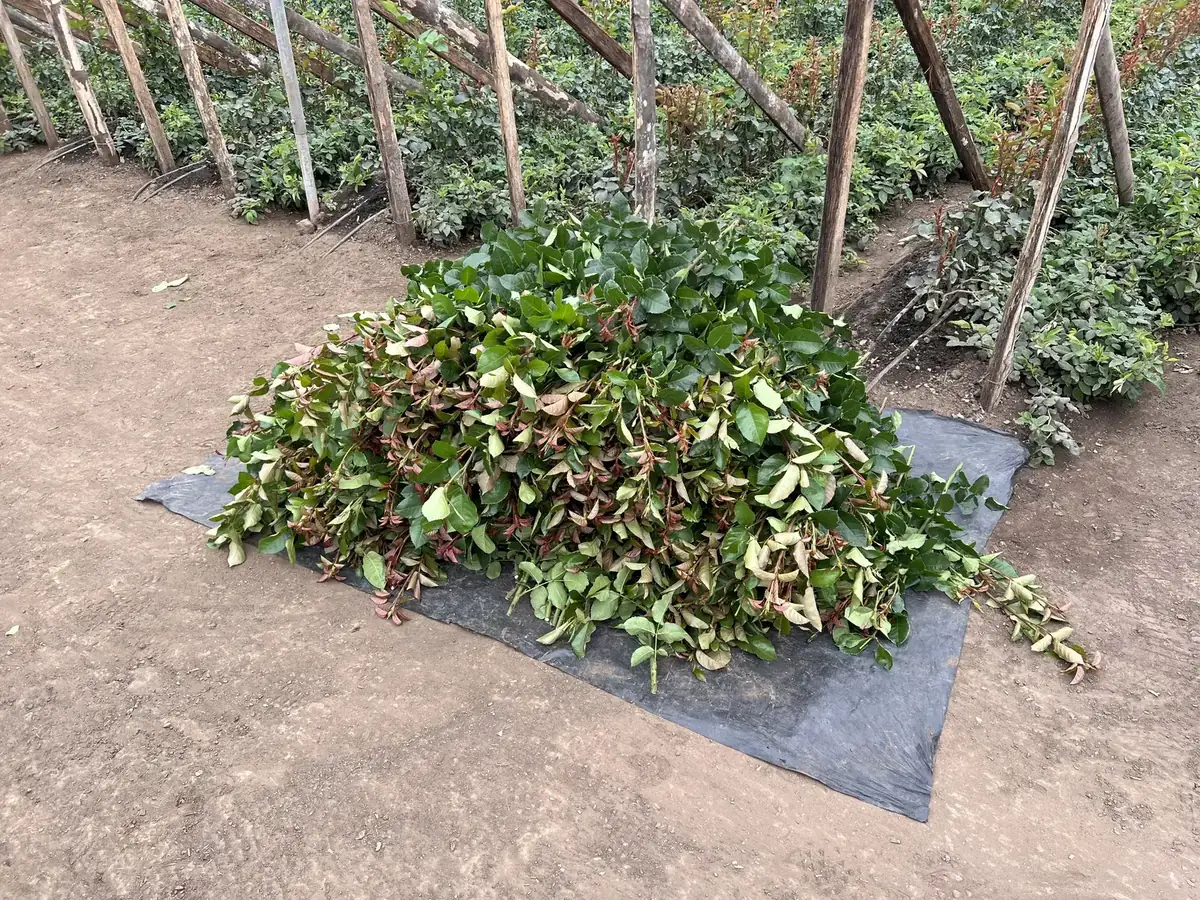
In rose production, pinching stimulates new growth cycles and pruning maintains plant health. Both happen at scale, across multiple greenhouses, every week. The problem: they frequently go unrecorded.
“There are crop loss visibility problems because [teams] do not always report the same thing, or they do not report at all. Greenhouse Supervisors often do not report how much pruning they did.”
— General Manager, User Research Interviews
Without reliable records, production forecasts break down. Farms make yield and resource decisions while flying blind on a significant share of their activity. The Rose Pinch Manager is a role-based platform designed to close that gap, simplifying data entry for the field while giving the office the real-time visibility it needs to act.
| Before | After |
|---|---|
| Supervisors logged pinches and pruning on paper, or skipped it entirely | Mobile task view lets supervisors log completions in under 30 seconds, directly from the greenhouse |
| Office technician coordinated activity across 20+ greenhouses via a single Excel sheet | Desktop dashboard gives real-time visibility into task status across all greenhouses |
| Completed field work reached the office with a lag, sometimes not at all | Field activity syncs to the office dashboard the same day |
| Discretionary cuts went unrecorded: no safe, frictionless way to report them | Dedicated module for spontaneous pinch reporting removes the friction and the fear |
Discovery: From Notes App to Ground Truth
We did not set out to build the Rose Pinch Manager from the start. The original brief was a general-purpose note-taking app for various farm activities. Field research changed that and the scope became focused.
The insight: To capture this “invisible” work, we could not just build a logger. We had to first standardize how programmed work is handled, building a foundation of trust and efficiency that makes reporting a non-event rather than a risk.
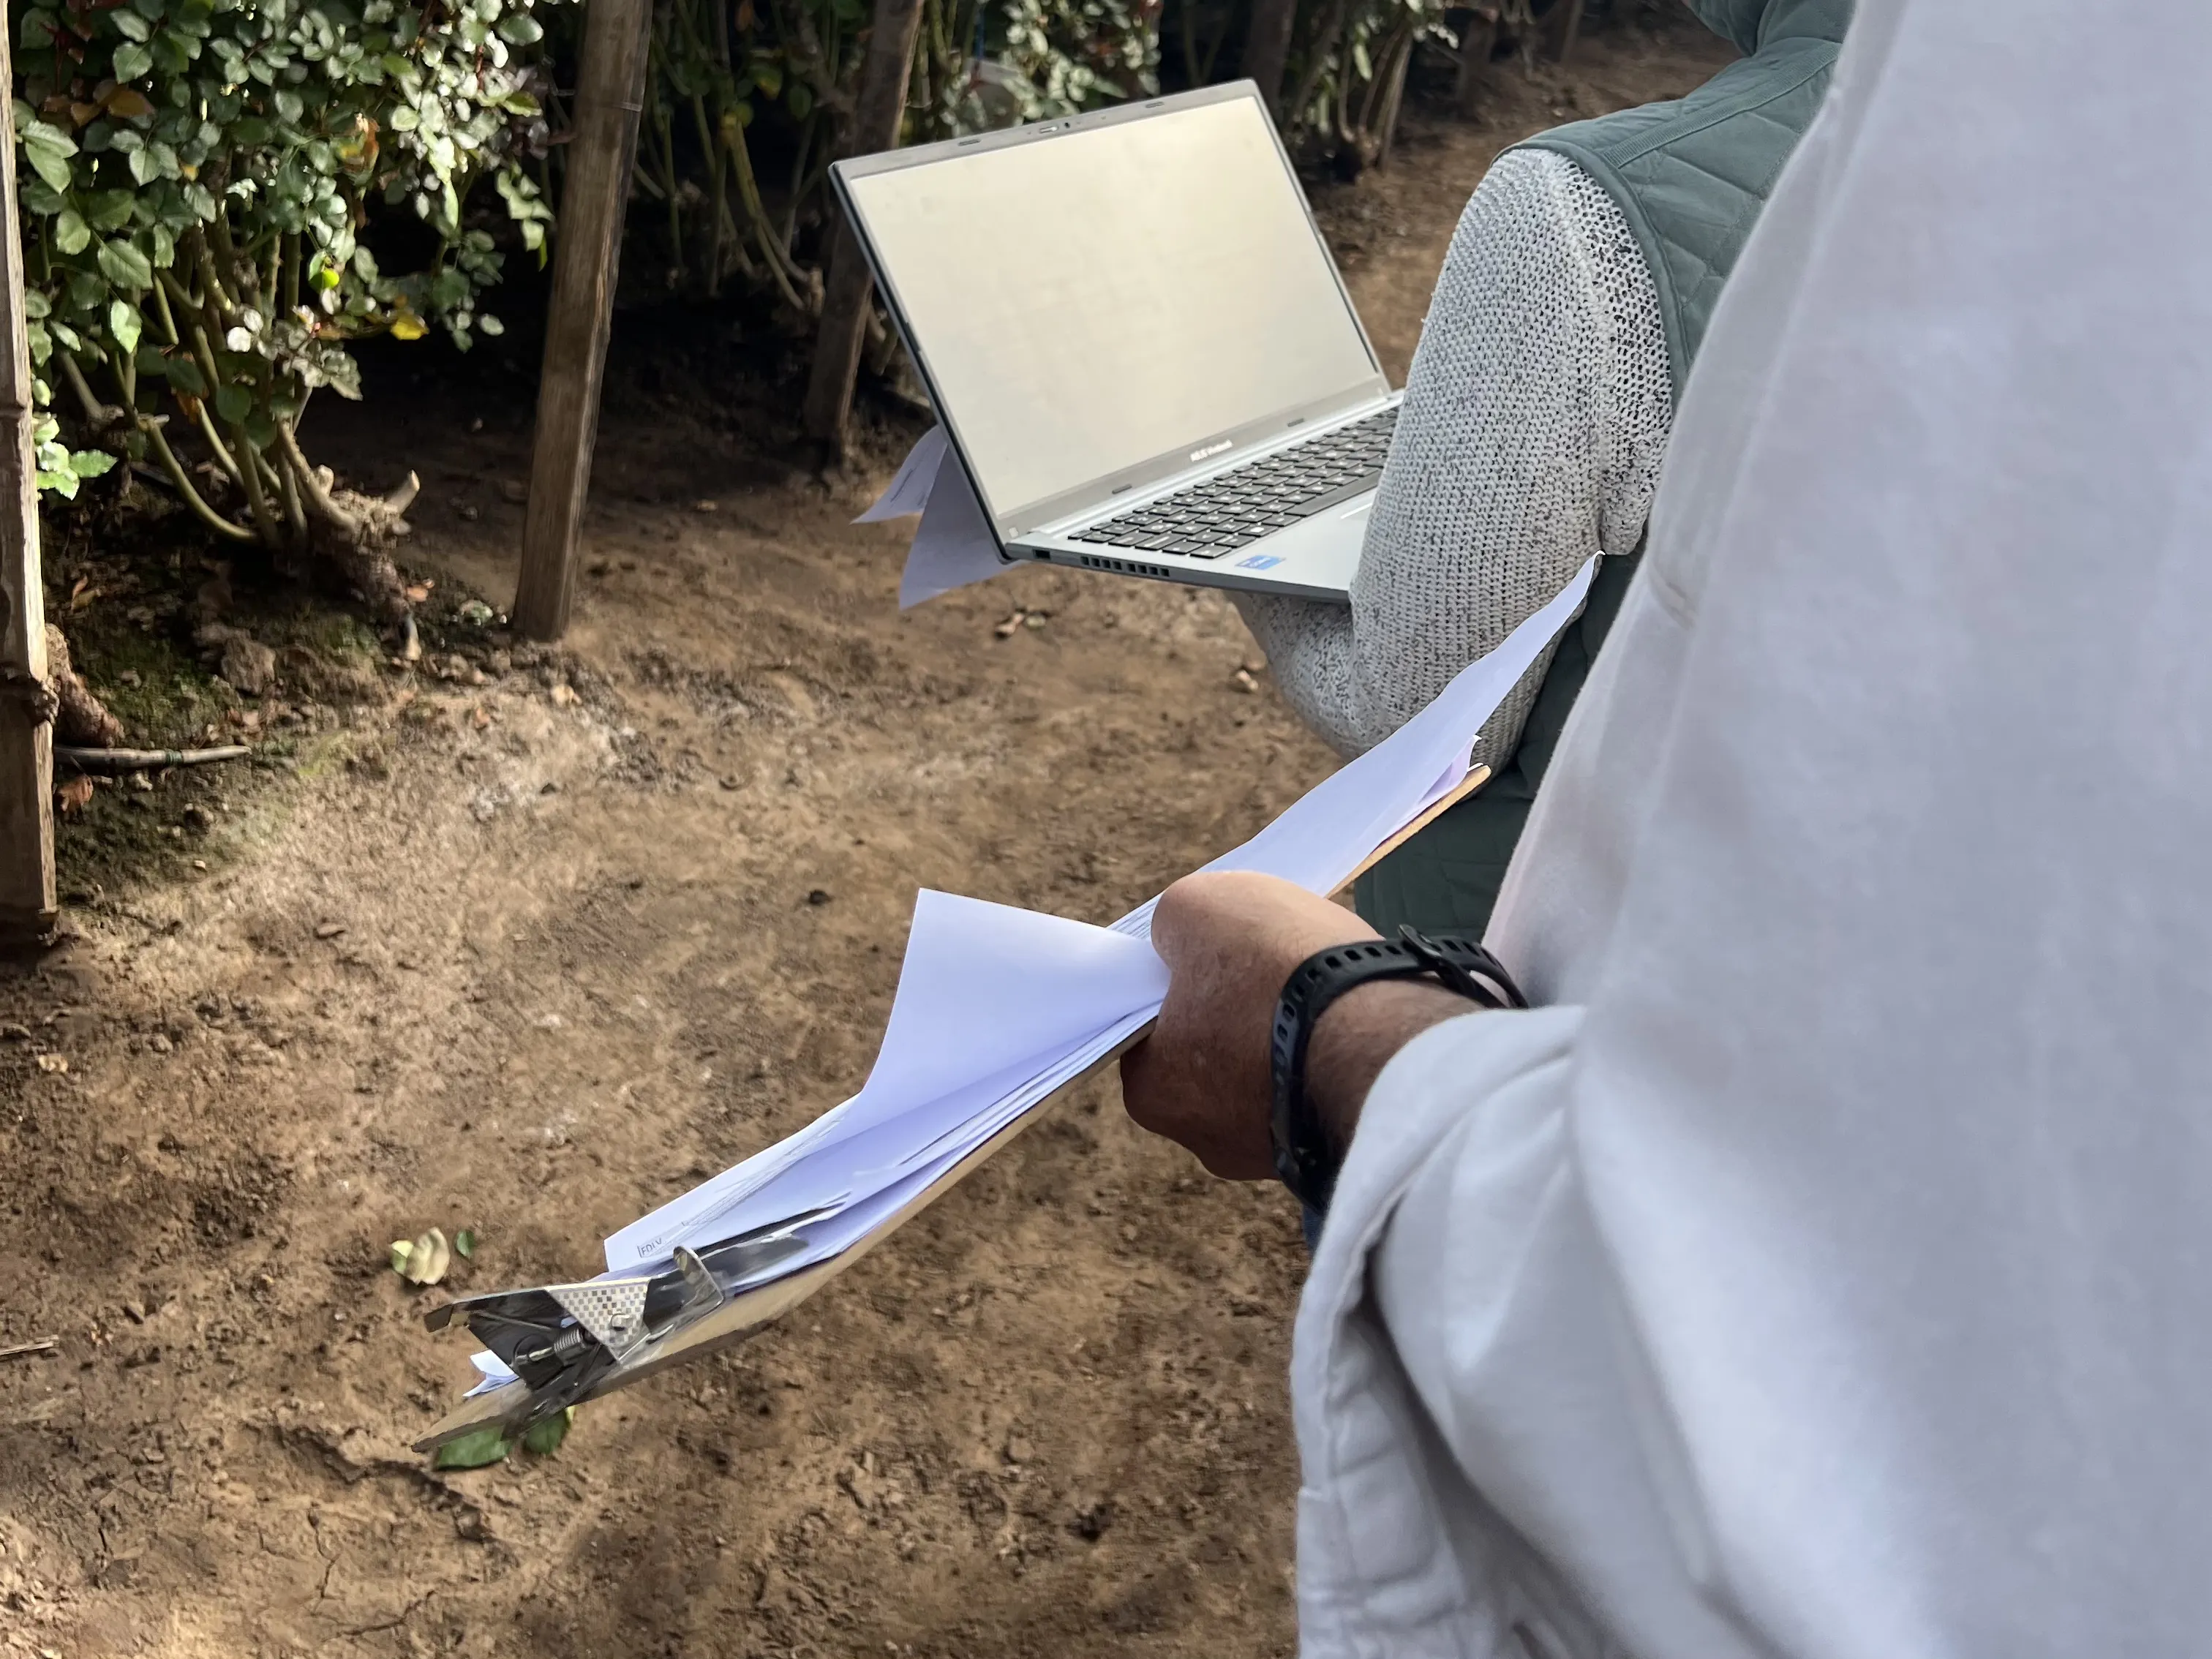
Interviewing and shadowing technicians and supervisors at the farm revealed a pattern a generic logger would have missed entirely, and that my initial note-taking designs had missed as well. Supervisors perform “sanitary pinches,” discretionary cuts based on tacit knowledge, without necessarily reporting them. Not out of negligence, but possibly out of fear of reprimand, lack of procedure, or simply having no frictionless way to do it.
The original note-taking design was not wrong, it was incomplete. It offered templates for logging activities (a pinch, a pruning, a product application) but missed something fundamental: the farm does not work ad-hoc. These activities are programmed, measured, and tracked against production targets. A flexible logger had no way to represent that structure.
Redesigning meant adapting the product to how people already work, rather than asking them to adapt to something new. That principle carried through to the final design: task creation works through the interface, or via an Excel upload using a provided template. If the fields are correct, the system accepts it. The product meets users where they are. Three focused research streams structured our approach:
Stakeholder Interviews: 6+ hours in individual sessions with three key stakeholders (Technical Manager, Farm Technician, and Controller) to understand current workflows, pain points, and data gaps.
Site Visits and Shadowing: 10 contextual inquiry sessions over 2 months.
Quantitative Survey: Gathered data from stakeholders to gauge priorities across a range of work themes.
The team shared a clear conviction: rose production was paper-based, fragmented, and prone to error. What no one yet knew was the right form for the solution. I led research to understand how activities were planned, executed, and recorded, and presented findings to the team. That process moved us from a generic activity logger to the Pinch Manager: a focused, role-based system built around how the farm already works.
Design: Bridging Field and Office
Asymmetric by Design
The original brief implied a single role-based tool accessible to everyone. Research made that approach unworkable. Field supervisors and office technicians do not just have different tasks; they operate in fundamentally different physical and cognitive contexts. A supervisor multitasks through a greenhouse: manages a team, often in intense lighting, with hands occupied. A technician goes between desk and field, coordinating data across 20+ greenhouses. A single responsive interface would have compromised both experiences. I proposed a dedicated mobile view for the field and a desktop dashboard for the office: a multi-device architecture matched to the reality of each role. We aligned on this structure early, and it became the backbone of everything that followed.
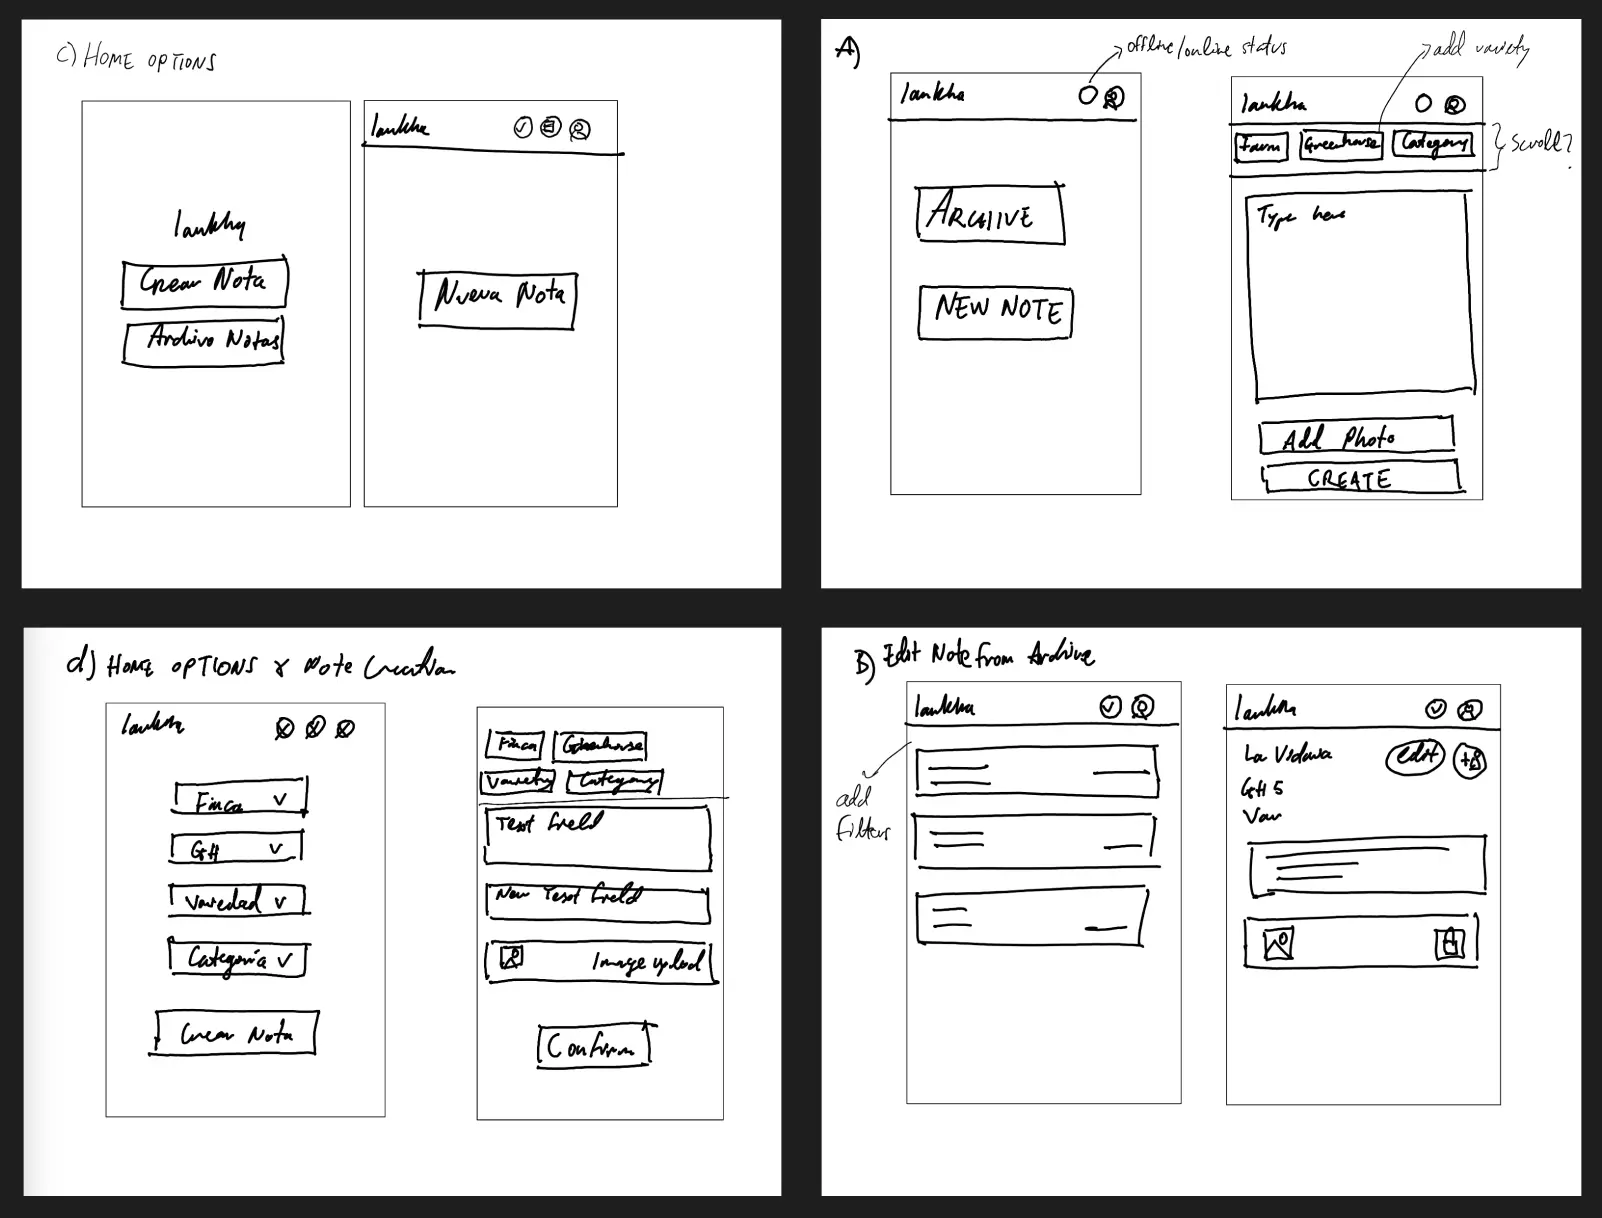
At first, I did not know anything about pinch-programming; I was simply aware that pinching happened regularly. Given budget constraints and a compressed timeline, I designed low-fidelity concepts, presented them to stakeholders, and updated the product definition in parallel with information-gathering and workflow research. This kept the team aligned while the scope was still being defined.
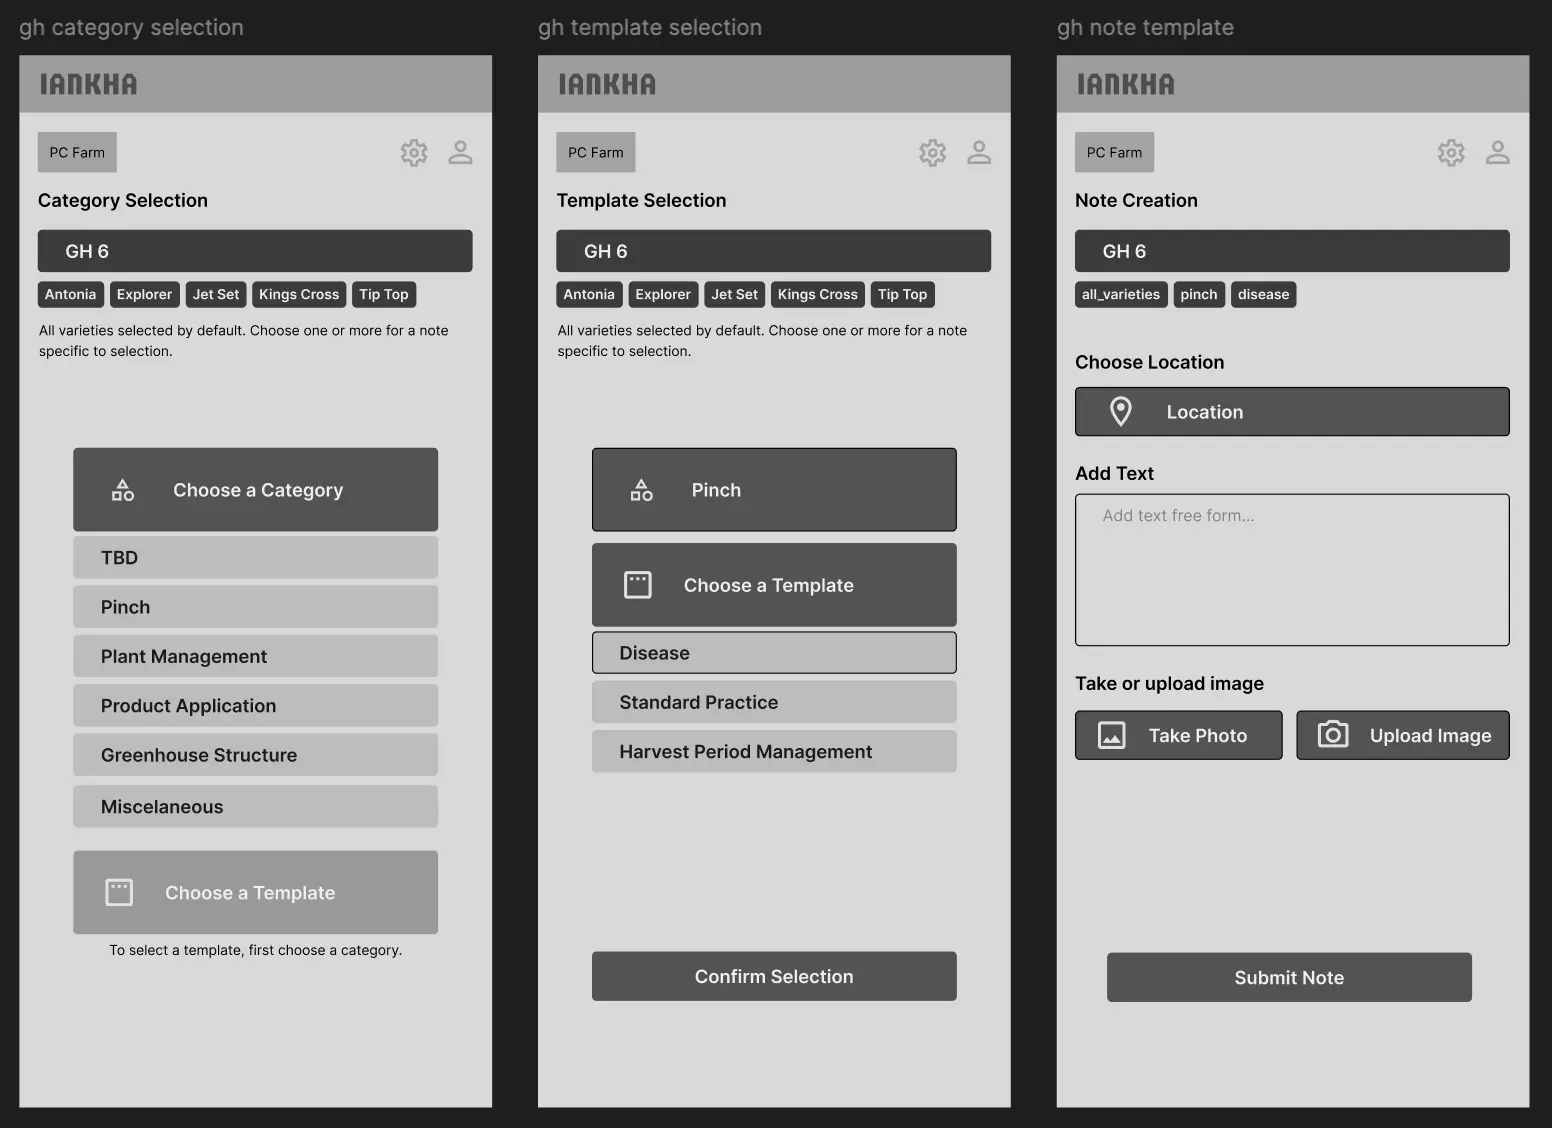
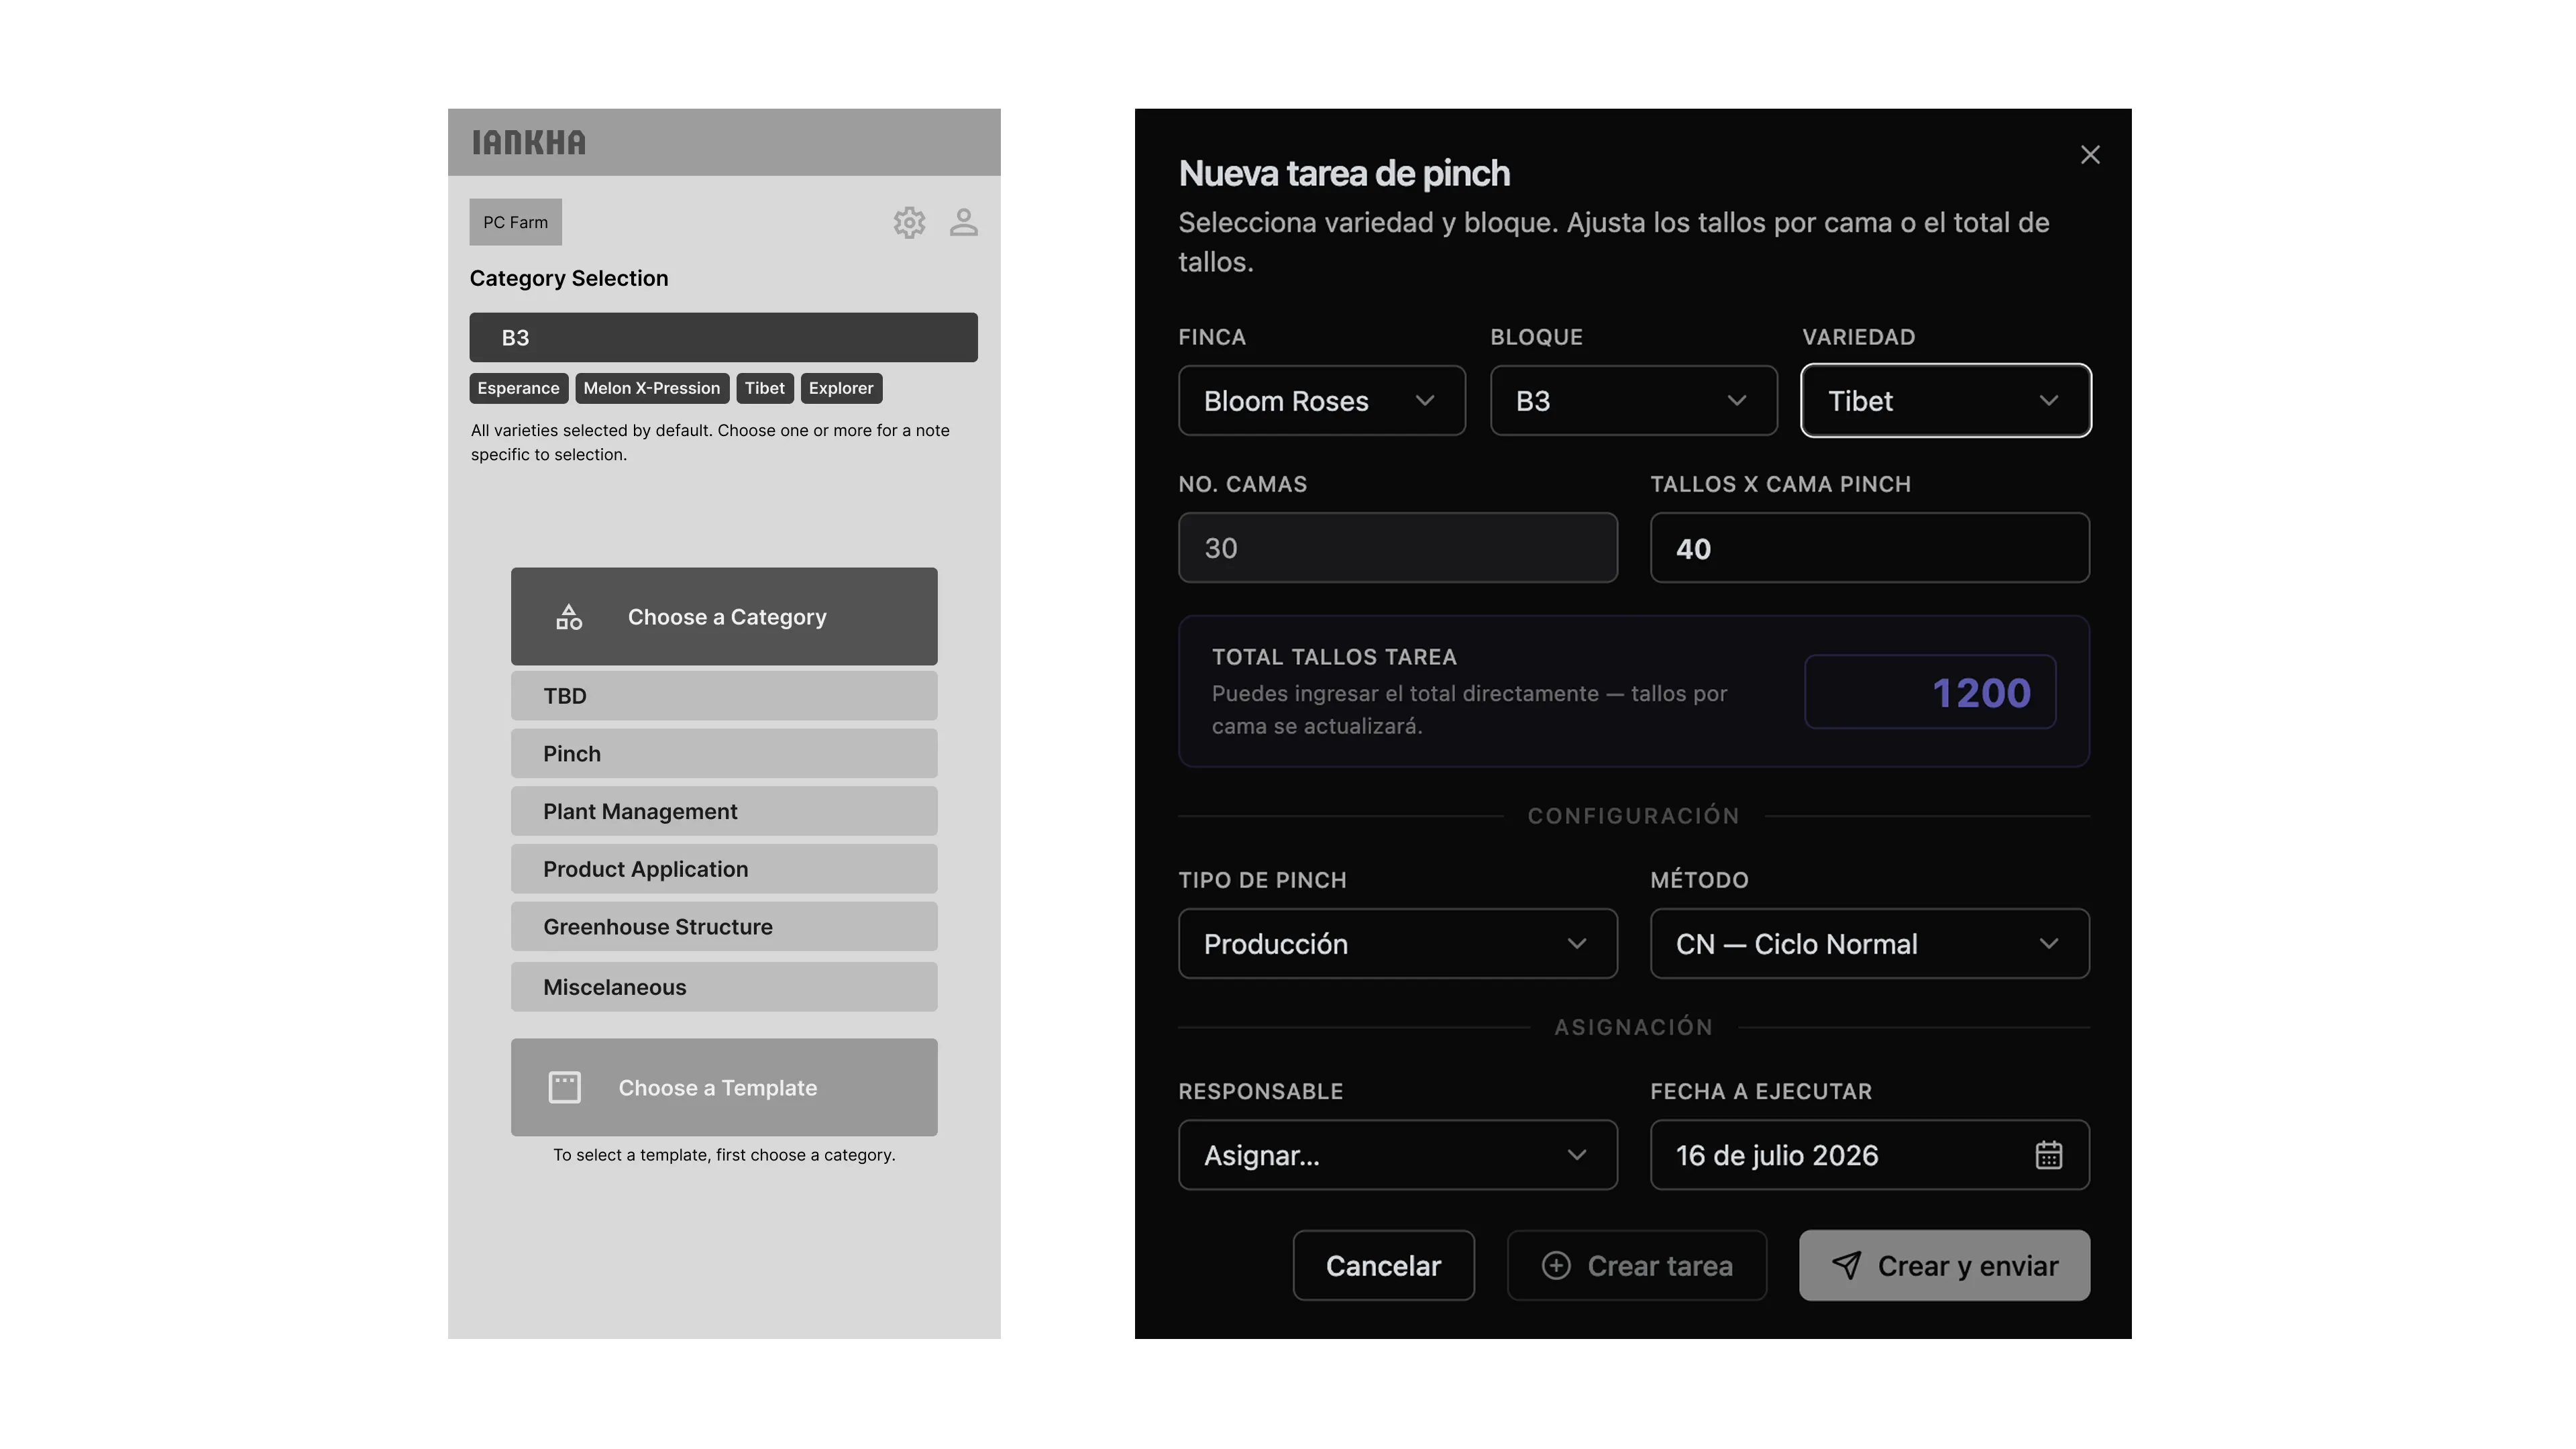
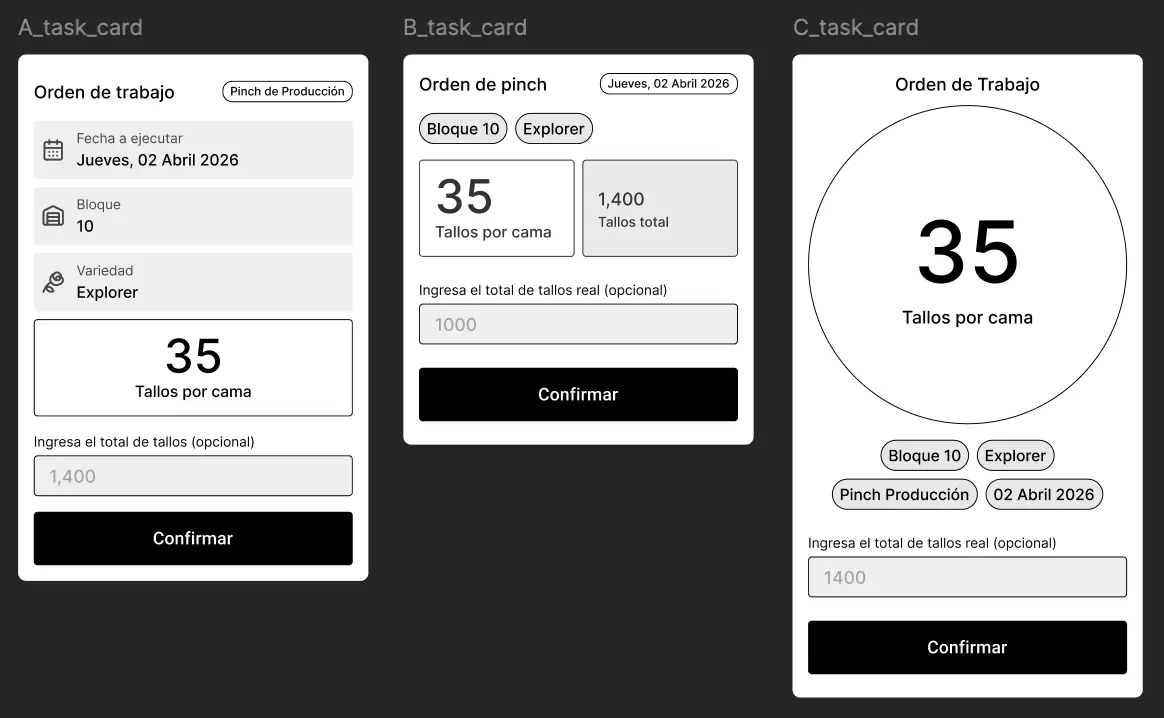
The Field Interface: Minimalist, high-contrast, one-tap actions for supervisors moving through greenhouses and managing teams.
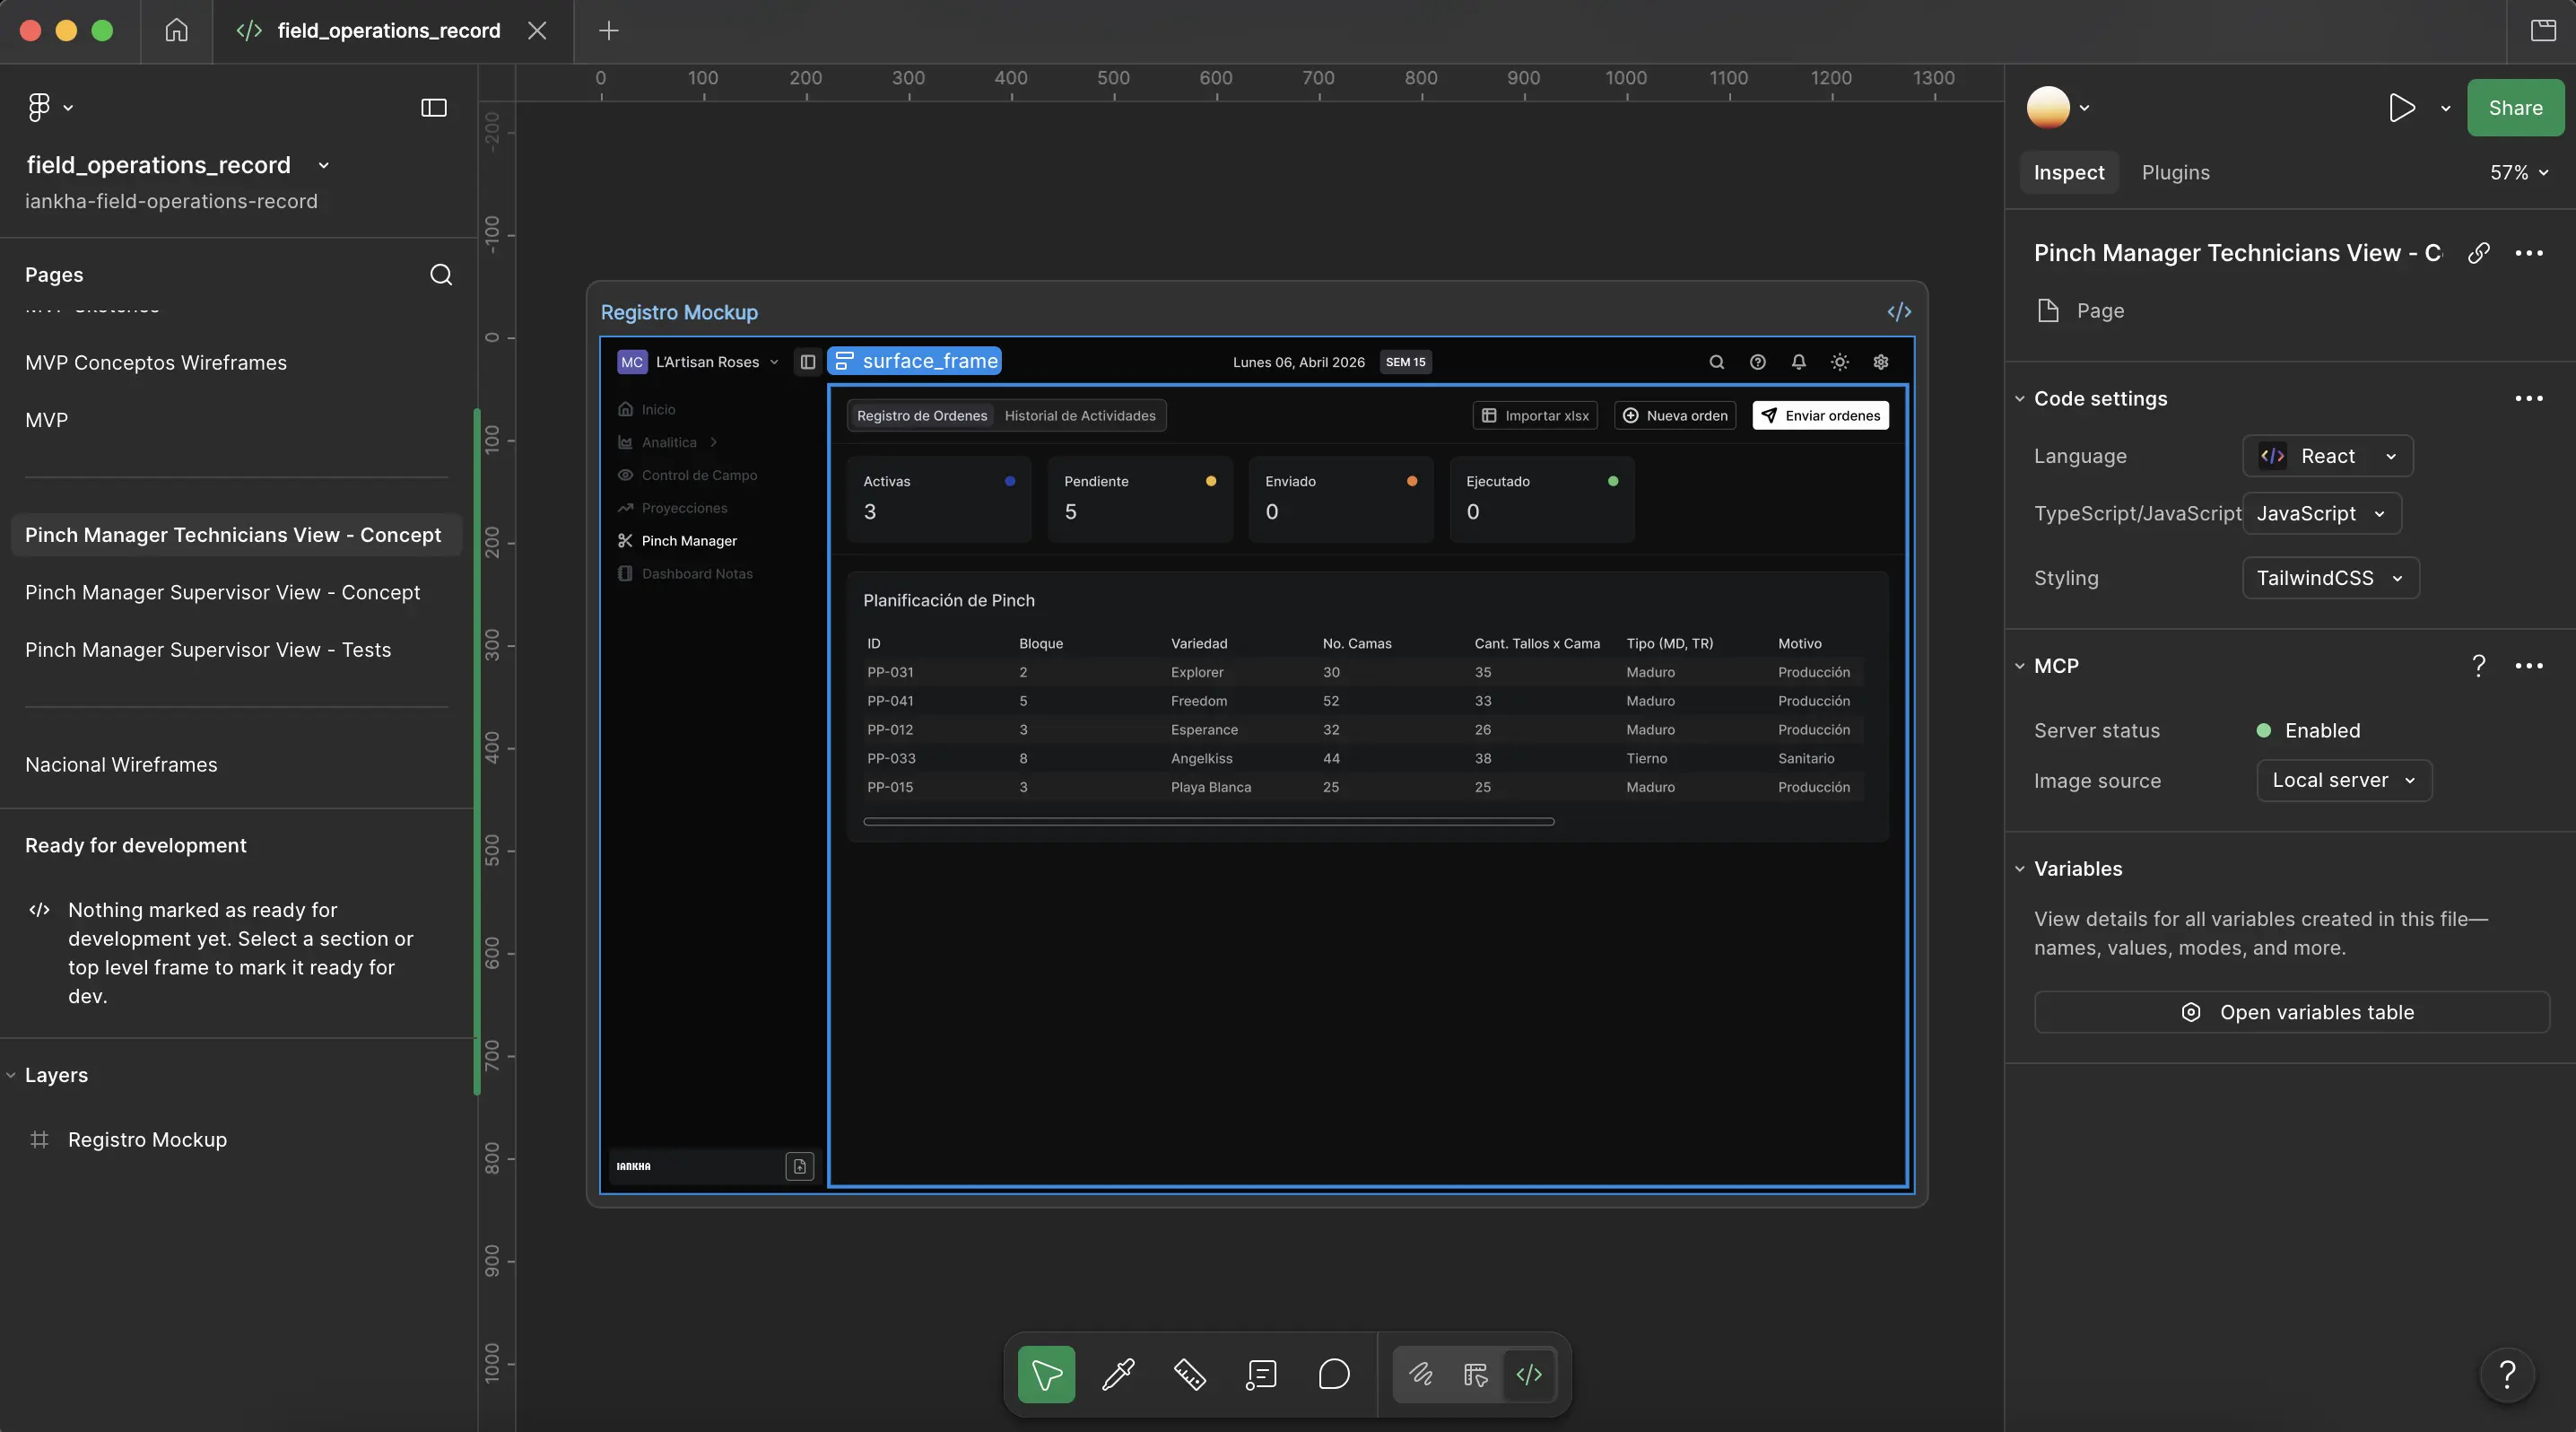
The Office Interface: A dashboard for managers to create pinch orders, verify field activity, and adjust numbers without the paperwork lag.
Prototyping and Handoff
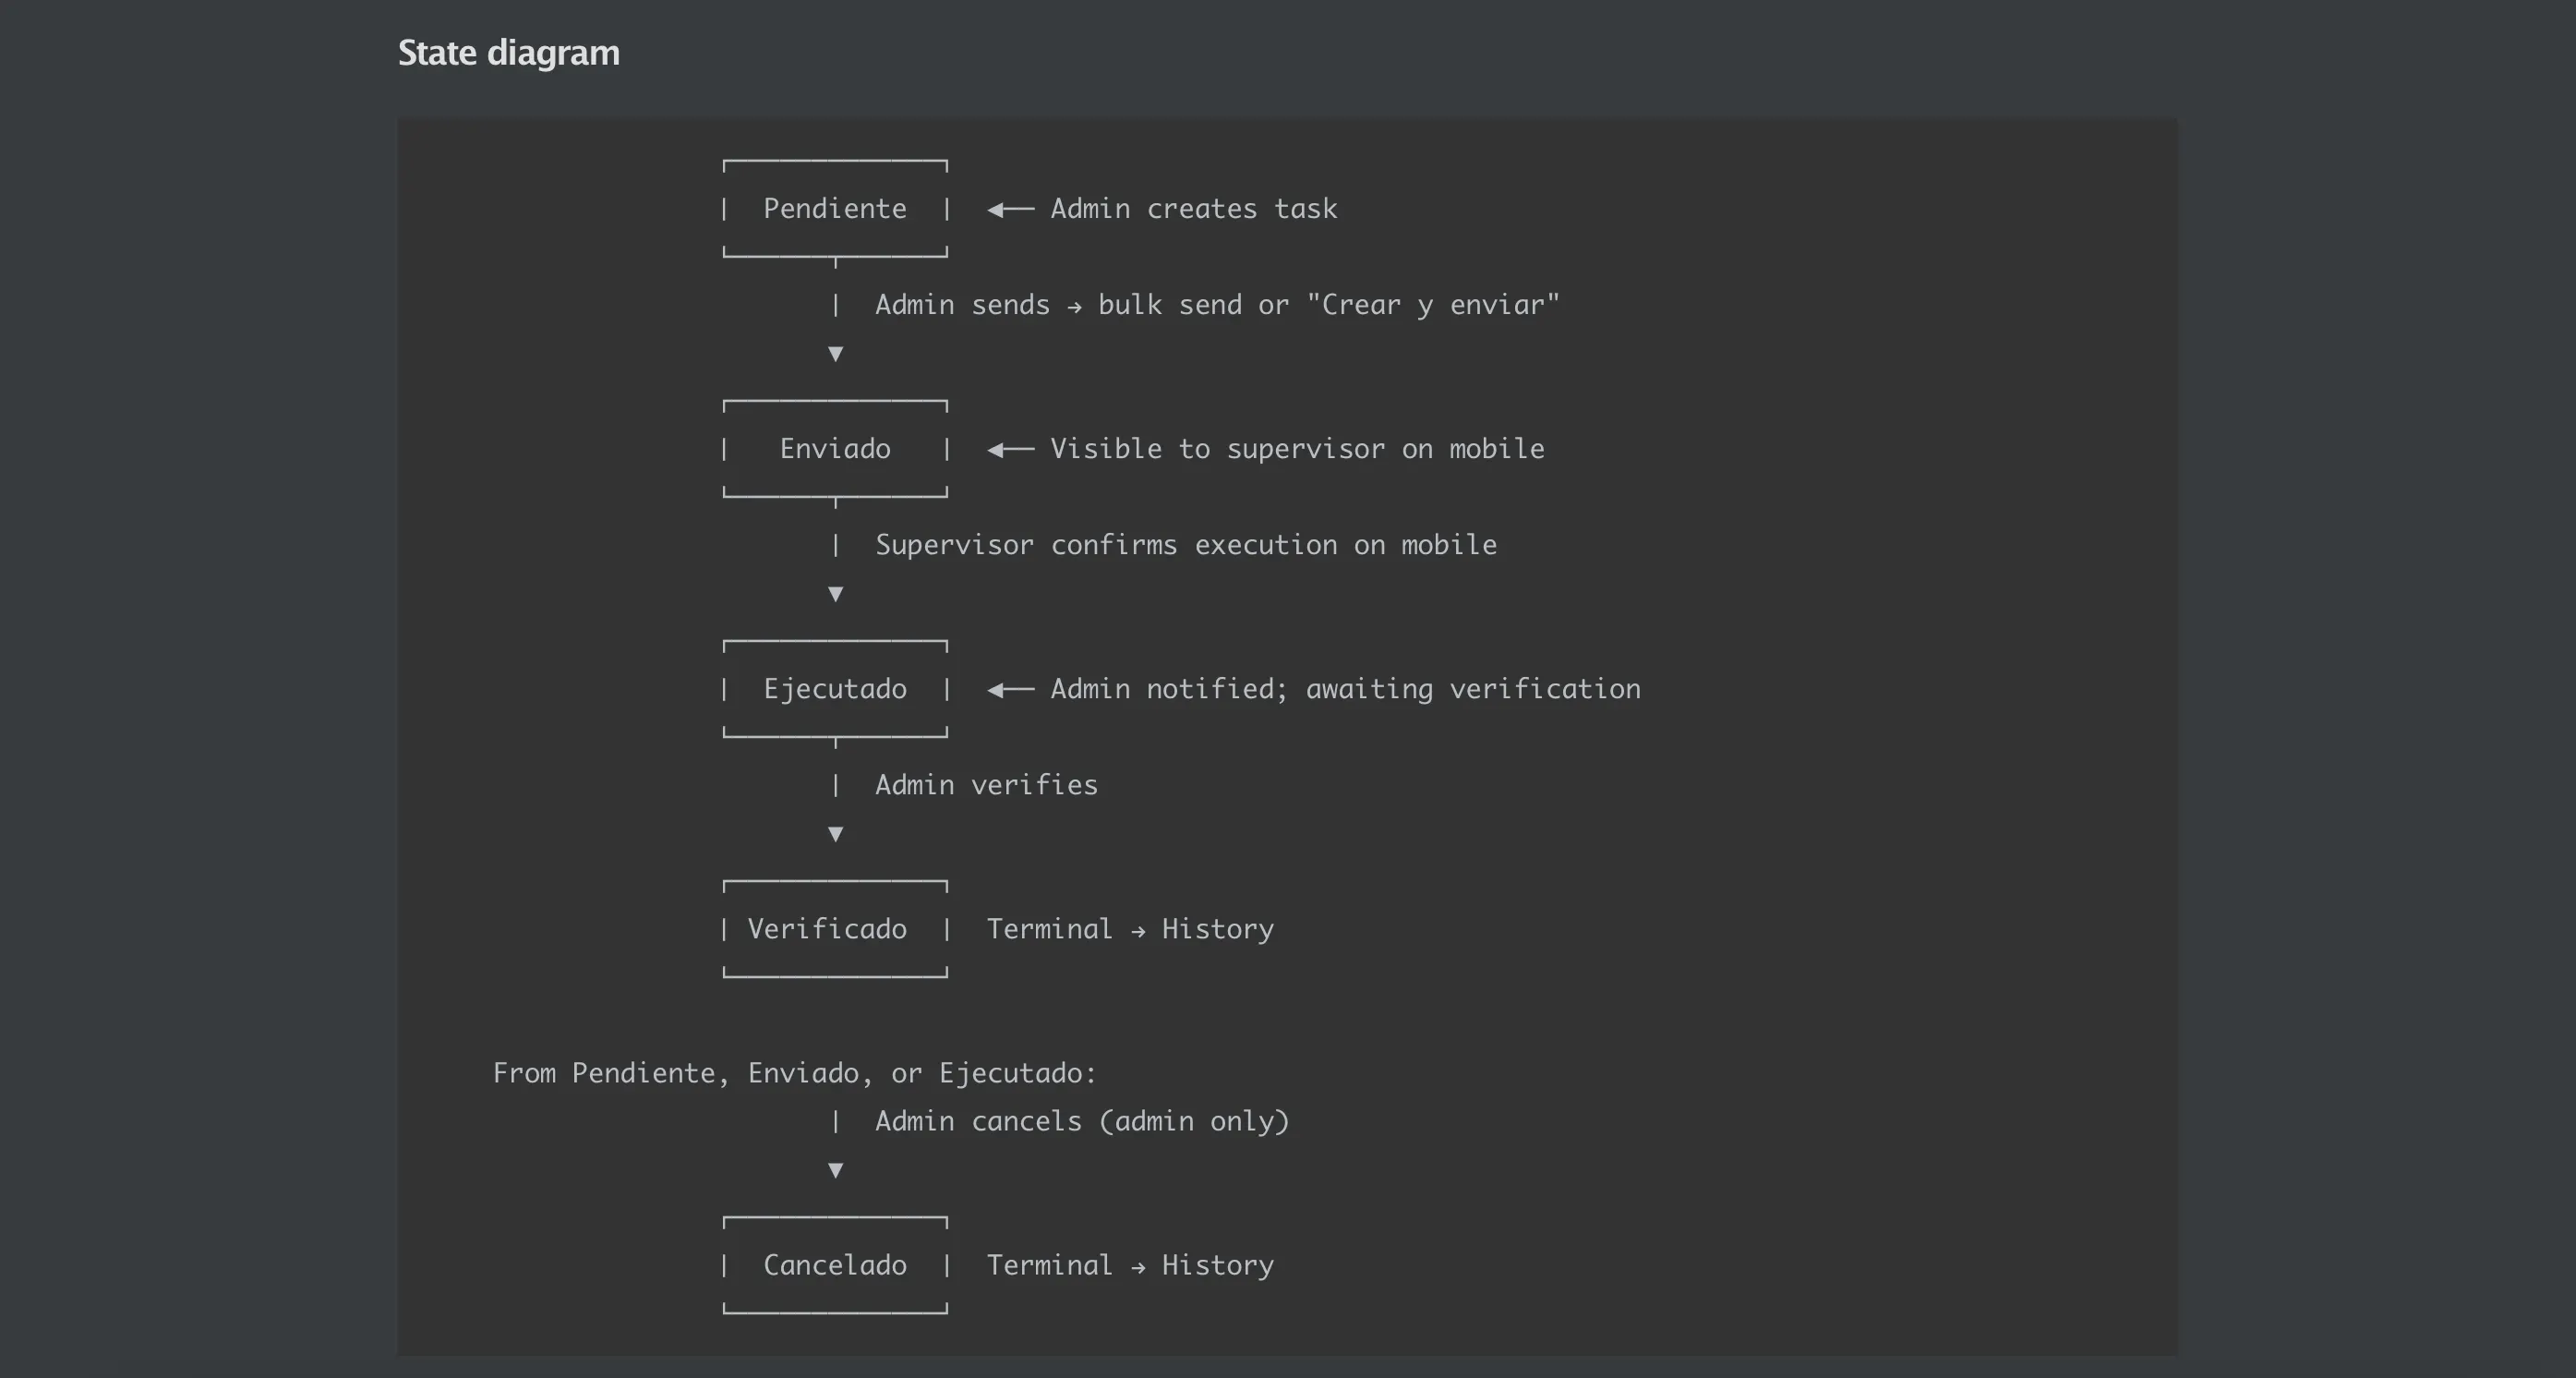
The project consisted of a three-person team: the CTO, a full-stack developer, and myself as the sole designer. I owned product definition from the start, establishing workflows, user roles, and interaction logic. The CTO shaped back-end constraints around an existing back-end design and a data warehouse, which I had to work within. Collaboration ran both ways: design also informed engineering decisions. Task states, for instance, started as a rough technical concept and evolved significantly once we mapped the full office-field-office flow through design.
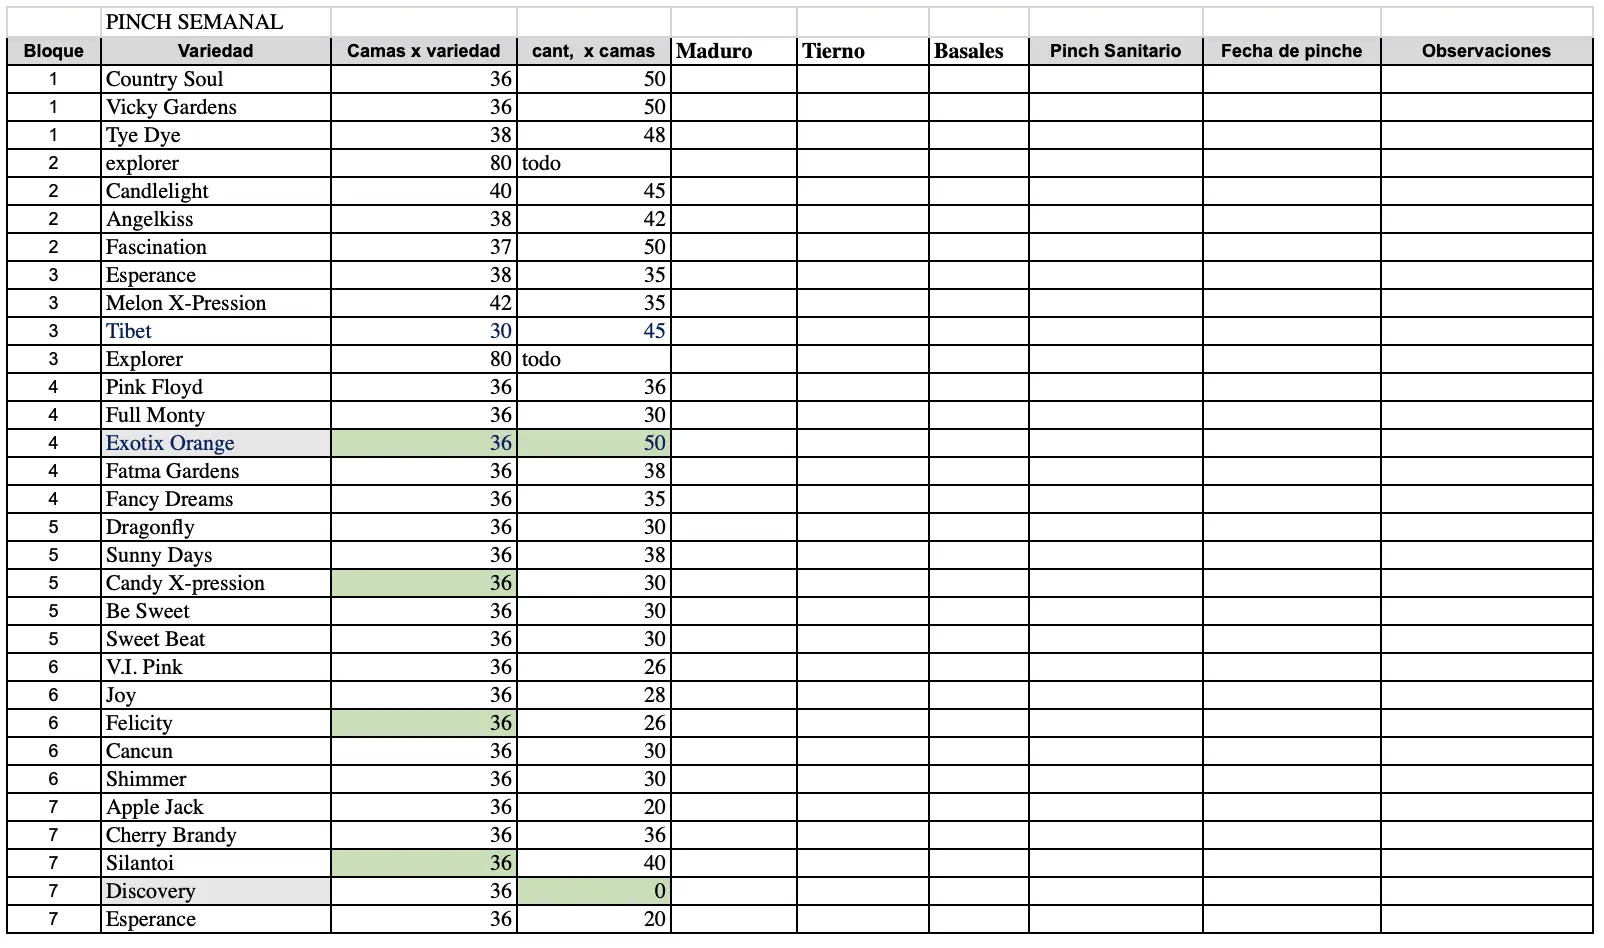
Standard Figma prototypes could not simulate the real-world complexity of this system: multi-role states, data logic, mobile/desktop handoffs. I used Claude Code to build a high-fidelity React prototype from a single Figma mockup, using the company’s existing design system for the rest. A working prototype in three days surfaced UX friction points, particularly around multi-interface state transitions, that static designs would have lacked. The product logic and interaction design were modeled on a single Excel sheet the technician previously used to generate and manage tasks.
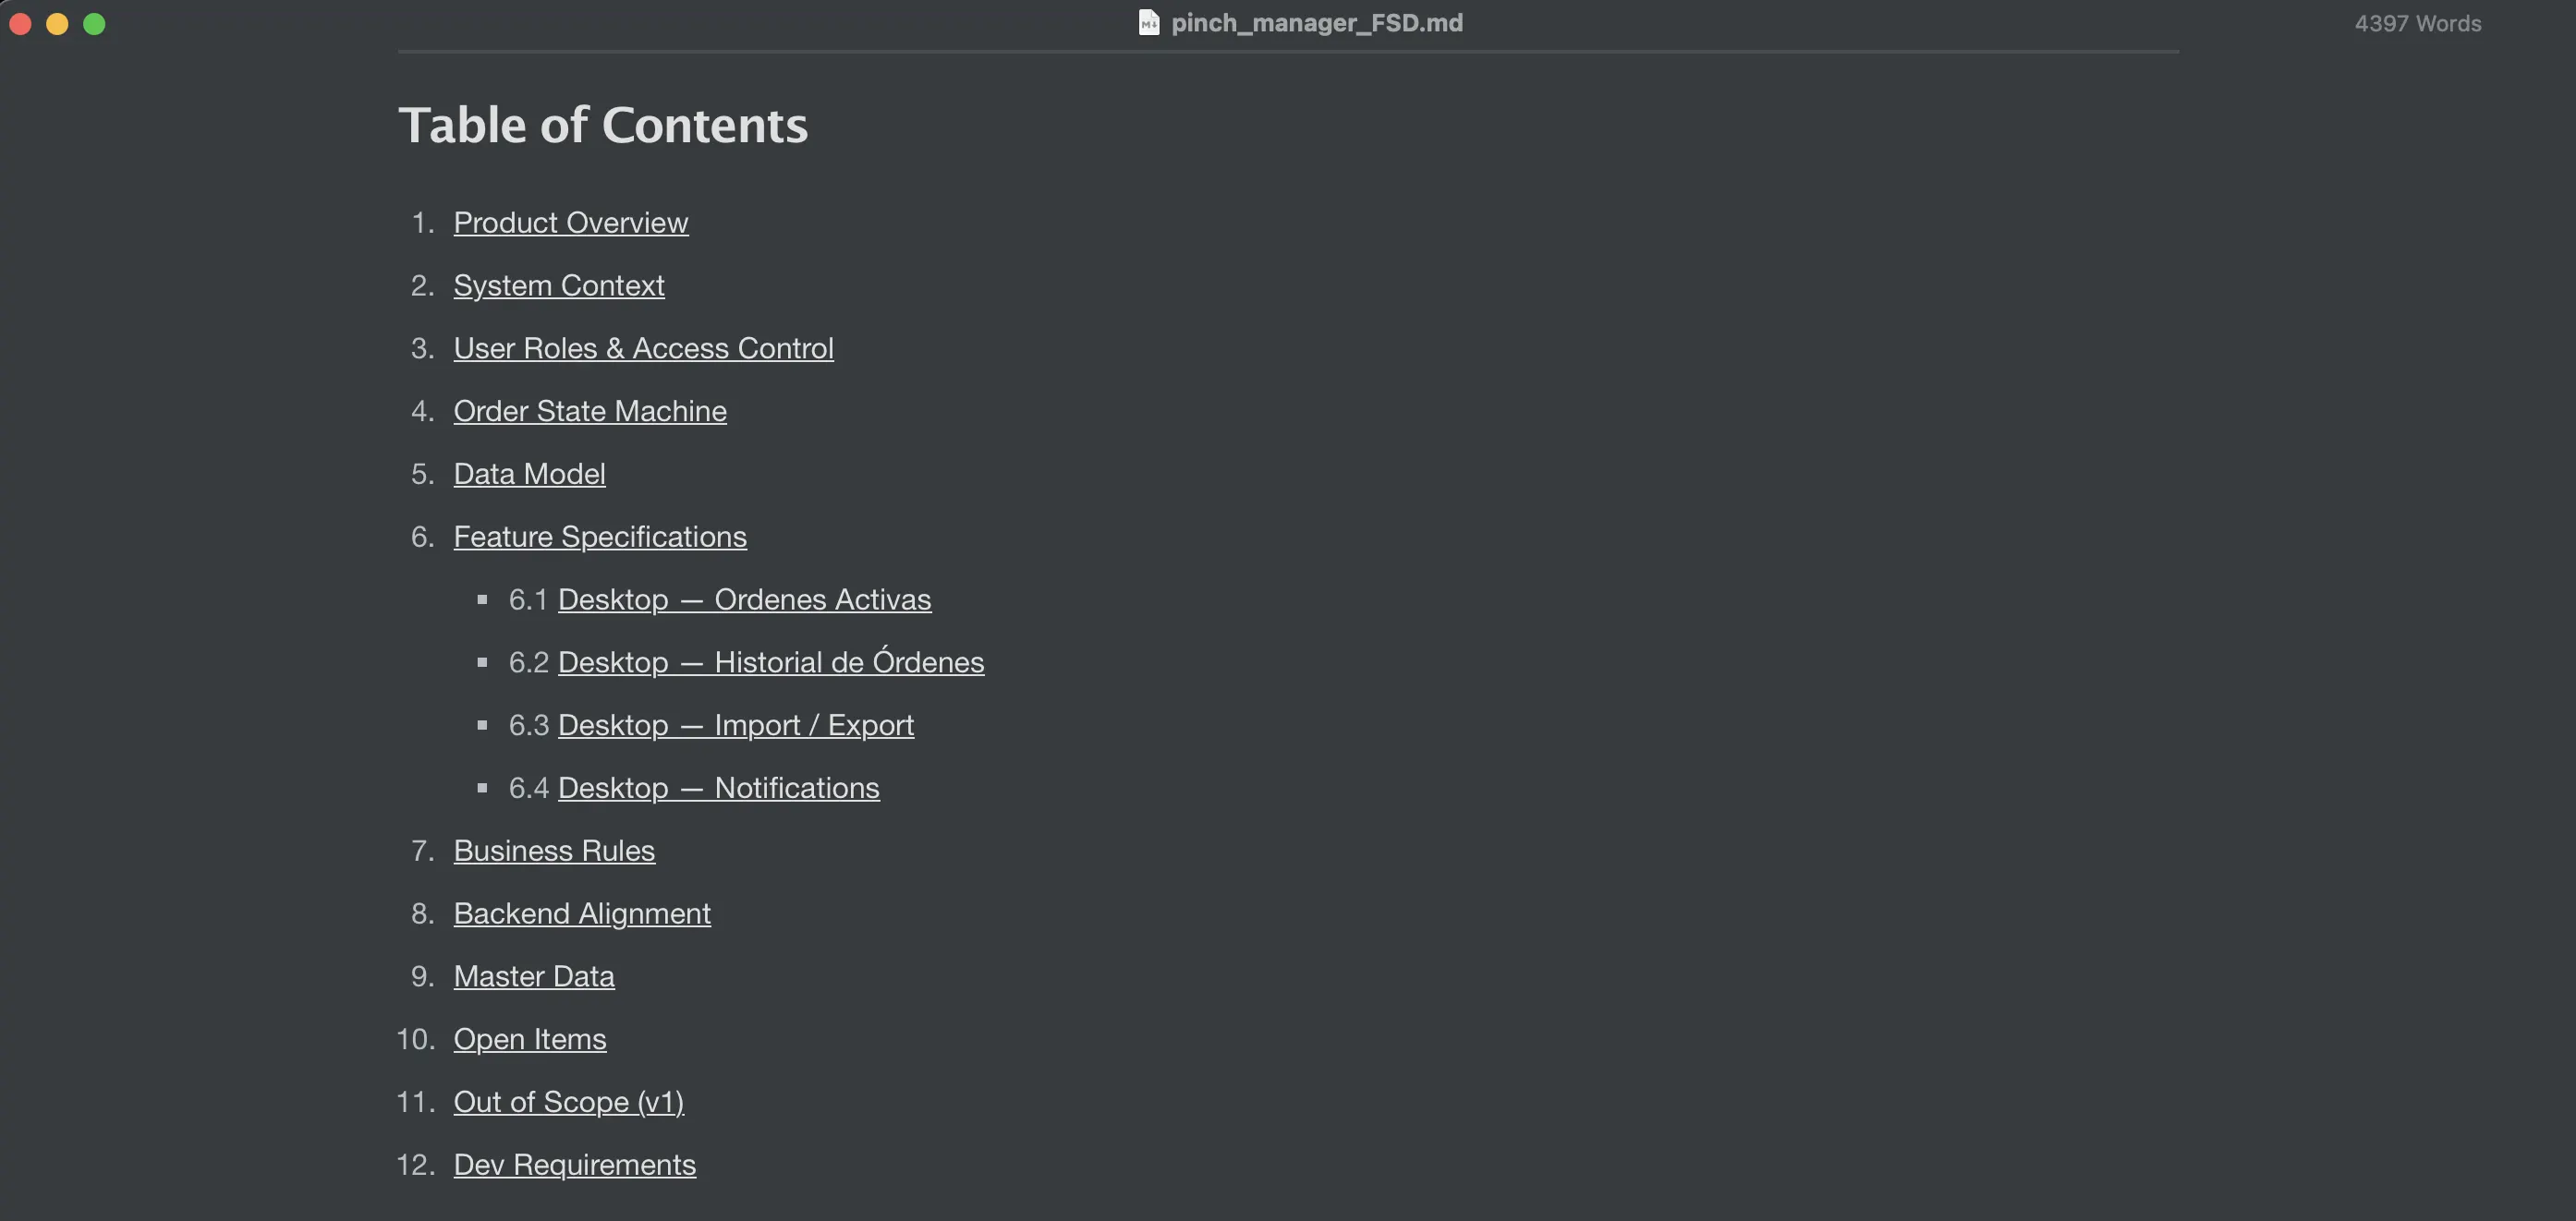
To close handoff, I delivered a Functional Specification Document (FSD) covering system context, user roles, order states, and a data model matching back-end requirements, reducing back-and-forth with engineering significantly.
Getting there required going deep on the domain. Beyond mapping the office-field-office information flow, I had to understand rose management from the technician’s perspective: pinch motives, rose cycles, and how to calculate the stems per rosebed to pinch at any given week. I ran usability tests to validate the designs and refine the product’s logic, ensuring the calculation method and its data requirements were fully scoped before handoff.
Usability tests: 4 tests spanning 3+ hours
In Production Since June 2026
Administrative efficiency, confirmed. The 1.5–2 hours per week we projected for the Farm Technician holds in practice. Manual entry is gone: activity arrives in the app instead of being reassembled from fragmented logs across 20+ greenhouses. That time moved to field visits and reviews, which is where a technician is worth more.
The field half works. Supervisors are logging pinch activity from the greenhouse on the offline app. This was the open question the whole product rested on — reporting only closes the gap if it happens at the point of work, and it does.
User satisfaction: SUS of 89.17 from the beta round, in the excellent band. A second usability round is scheduled to test the shipped product rather than the prototype.
Task creation: under 30 seconds to generate a new pinch task.
Understanding What to Build
The hardest part was not the UI design, or even mapping the multi-role state logic. It was understanding what to build. Without going into the field and the farm office, we would have shipped a generic logger and called it done. The real problem only revealed itself through observation and understanding user needs.
Next
Non-programmed logging: Now that the ground truth foundation is in place, we are testing a module for spontaneous pinch reporting, and learning whether under-reporting stems from fear, habit, or missing tooling.
On-field interactions: Continuing to stress-test the supervisor flow with edge cases and additional input types.
Phase 2: Calculation and Analytics (in design, ~1–2 months): The next development cycle adds two core modules to the desktop platform: a stems-per-bed pinch calculator to automate what is currently handled manually in spreadsheets, and an analytics layer to surface activity trends across greenhouses over time. Both will integrate with the larger agri-tech project this platform is part of, closing the loop between field recording, office oversight, and data-driven production decisions.
Signals
Over time, three signals will tell us whether the invisible work has actually become visible, and stayed that way:
Reporting Compliance: Digital logs measured against historical manual records and actual harvest numbers. Gaps between what was logged and what was harvested surface where the invisible work still lives.
Harvest Accuracy: Whether this system’s data allows production targets to be set with confidence, replacing guesswork with a ground-truth record of what was actually pinched.
Operational Integration: Whether the offline-first workflow becomes the default working method for supervisors and technicians, replacing fragmented paper-based reporting.